Data intelligence for prediction markets
A platform to analyze trends, volumes and order books on blockchain-based prediction markets.
The starting point
Prediction markets are increasingly resonating in the investment world. However, in their raw state, markets are saturated with noise, cognitive biases and speculative movements that are hard to interpret. Institutional investors and professional traders face an invisible barrier: the standard interface doesn't reveal the true market dynamics, nor the capital flows of the "smart money".
The problem we found
The challenge is to build an independent, data-driven "intelligence layer". The goal: to create a Web3 SaaS platform that aggregates heterogeneous data (on-chain, order book and AI sentiment analysis), triangulating them to isolate clear market signals from background noise, providing an "institutional-grade edge" without requiring complex technical skills from end users.
Technologies used


Institutional on-chain
Enable real-time tracking of on-chain transactions that the standard graphical interface hides or simplifies.
Data triangulation
Cross-reference market financial volumes with social sentiment analysis (via artificial intelligence) to validate or invalidate the countless narratives.
Anomaly identification
Develop an algorithmic radar system to intercept unusual volume spikes or significant misalignments before the mass market notices.
Frictionless web3 SaaS model
Implement a crypto-native subscription management system, ensuring a secure and smooth onboarding experience for the professionals in the sector.
Focus on features and solutions
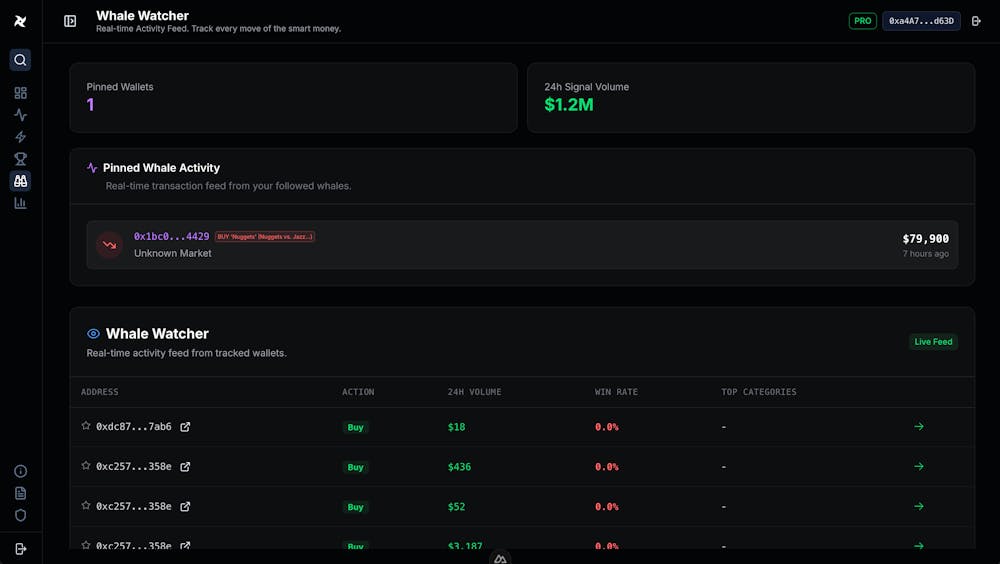
Watcher and tracking
We developed a module entirely dedicated to monitoring the smart money. The platform lets you anchor ("pin") specific accounts, viewing the activity of the large investors followed, their historical win rate, and aggregating the market volume moved in the last 24 hours.
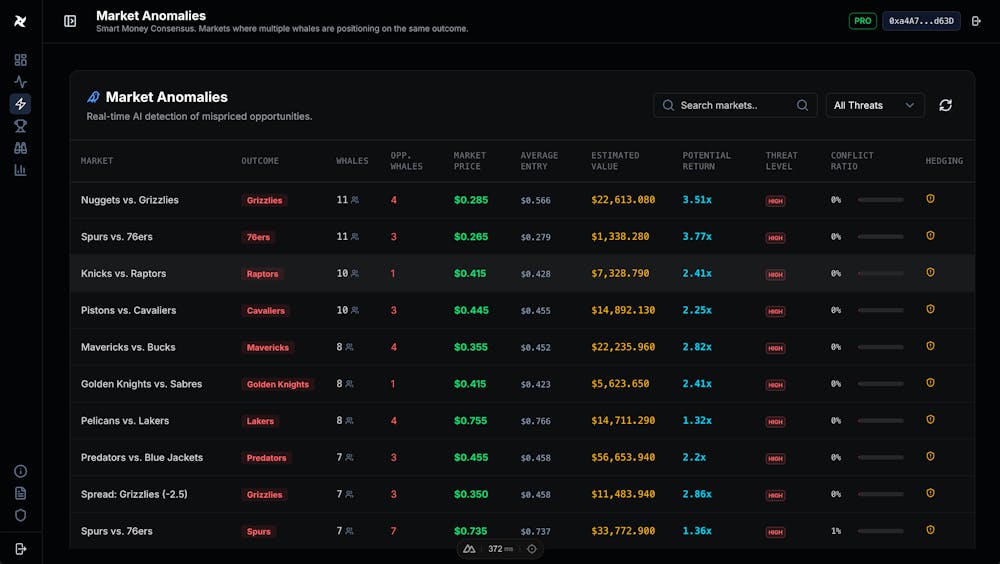
Volume anomalies
The data engine continuously analyzes the market ecosystem to isolate chart anomalies and discrepant volumes, such as a massive inflow of liquidity not justified by immediate public news. This radar lets you understand where, under the radar, the large investors are positioning themselves.
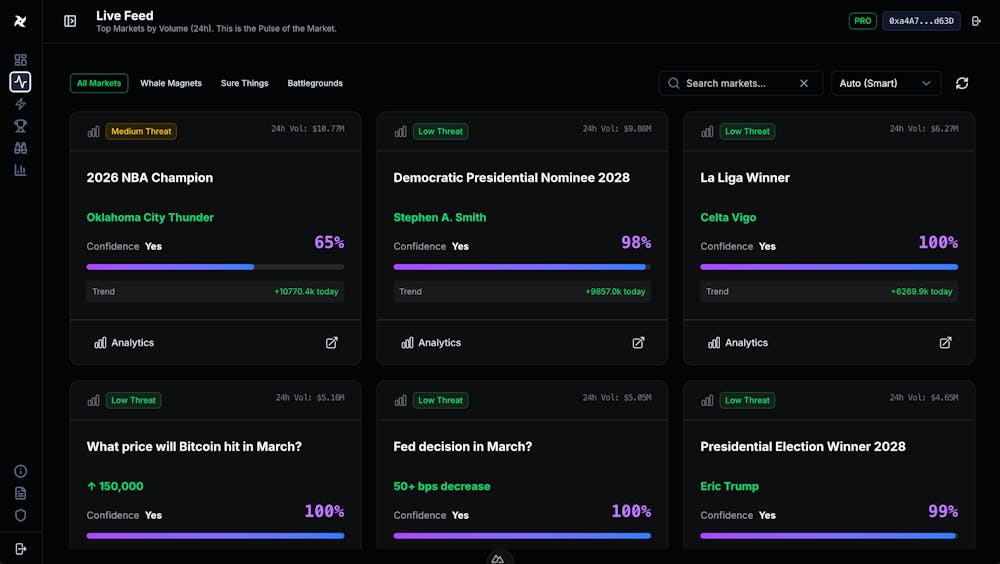
Institutional live feed
A live event stream decodes on-chain data and shows, line by line, the massive entries and the hedges (spreads), visually grouping the higher-weight operations into specific branches of interest.
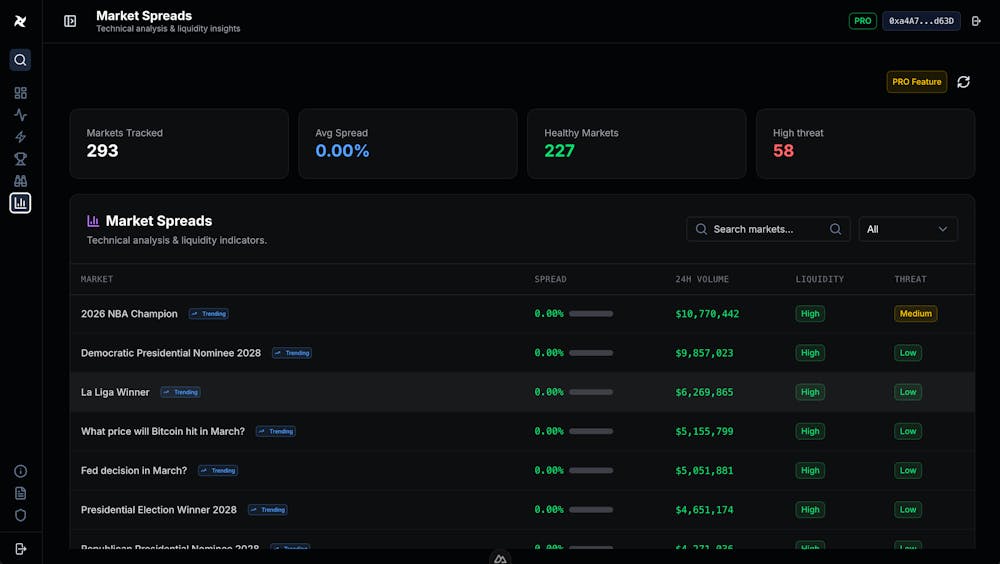
Order book and spread
Integration of tools to visually dissect the bid/ask quotation spread on the markets. Understanding the density of the order book through these features significantly speeds up decisions on the various contracts.


Do you have a similar project?
Do you need to translate a flood of information fragments into business patterns and operational dashboards? Let's schedule a call and get in touch.